
Creating visually engaging and informative content is crucial for any website, and one of the best ways to achieve this is by using charts and tables. For Wix users, the right charts and tables apps can transform complex data into easily digestible visual elements, making it simpler to communicate important information to your audience. Whether you’re looking to display sales data, track progress, or present research findings, these apps offer versatile and customizable options to suit your needs. Selecting the best app is essential to ensure you have the right tools to enhance your site’s functionality and aesthetic appeal. In this blog post, we will showcase some of the top charts and tables apps available for Wix, highlighting their standout features and how they can benefit your website. Get ready to discover the perfect app to elevate your data presentation and engage your visitors like never before.
The Best Wix Charts and Tables Apps at a Glance
| App Name | Best For | Standout Features |
|---|---|---|
| Table Master | Creating customizable tables | Drag-and-drop table builder |
| Google Sheets Table | Integrating Google Sheets data | Real-time data synchronization |
| Numbers: Show Animated Stats | Displaying animated statistics | Eye-catching animation effects |
| Common Ninja Charts & Graphs | Creating interactive charts | Wide variety of chart types |
| Statify Pro | Presenting statistical data | Detailed data visualization options |
| Visual Stats Bar | Visualizing data in bar format | Easy-to-customize bar styles |
| Numbers & Stats Counter | Showing numerical data counters | Real-time counter updates |
1. Table Master
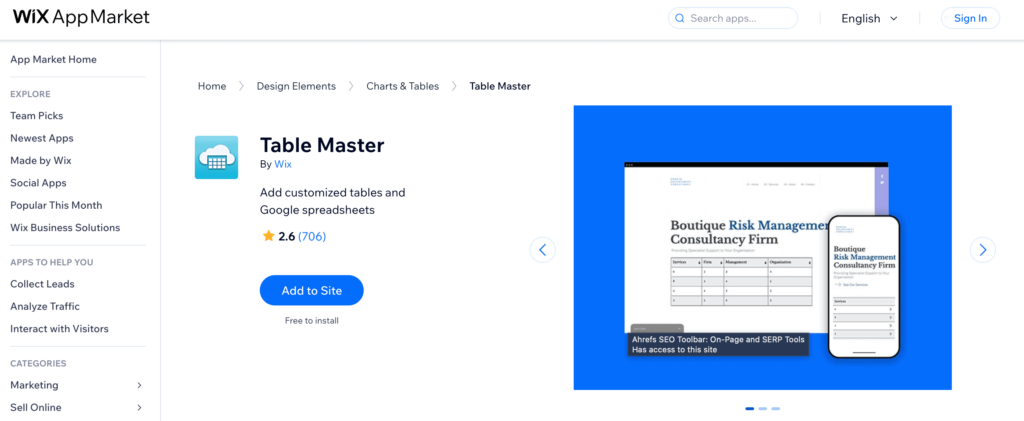
Table Master is a versatile app designed to make the creation and customization of tables on your Wix site a breeze. Whether you need a simple price list, a detailed comparison chart, or an intricate data table, Table Master provides a user-friendly drag-and-drop builder that allows you to design tables to fit your specific needs. With a range of customization options, you can adjust colors, fonts, and layouts to match your site’s aesthetic perfectly. This app is ideal for anyone looking to present information clearly and attractively, making it easier for visitors to digest and engage with your content.
Table Master Features
- Drag-and-Drop Builder: Easily create and customize tables with a simple drag-and-drop interface.
- Customizable Design: Adjust colors, fonts, and layouts to match your website’s aesthetic.
- Responsive Tables: Ensure your tables look great on all devices, including mobile and tablet.
- Data Import: Quickly import data from CSV files to populate your tables.
- Interactive Elements: Add sorting, filtering, and pagination options for enhanced user interaction.
Table Master Pricing
Basic Plan
- Create up to 5 tables
- Access to basic table templates
- Basic customization options
- Responsive tables
- Email support
Price: $5/month
Pro Plan
- Create up to 20 tables
- Advanced table templates
- Full customization options
- Responsive tables with interactive elements
- Data import from CSV files
- Priority email support
Price: $15/month
Business Plan
- Unlimited table creation
- Premium table templates
- Advanced customization and styling options
- Fully responsive tables with interactive elements
- Data import and export options
- Enhanced security features
- Priority support with live chat
Price: $25/month
Table Master Pros and Cons
Pros:
- User-Friendly Interface: Easy to use drag-and-drop builder for quick table creation.
- Highly Customizable: Extensive customization options to match your site’s design.
- Responsive Design: Tables are optimized for viewing on all devices, including mobile and tablet.
- Interactive Features: Options for sorting, filtering, and pagination enhance user interaction.
Cons:
- Limited Basic Plan: The Basic Plan offers limited table creation and customization options.
- Learning Curve: Advanced features might require some time to learn and fully utilize.
- Data Import Restrictions: Only supports CSV files for data import, which might limit flexibility.
- Cost: Higher pricing plans may be expensive for small businesses or personal sites.
2. Google Sheets Table
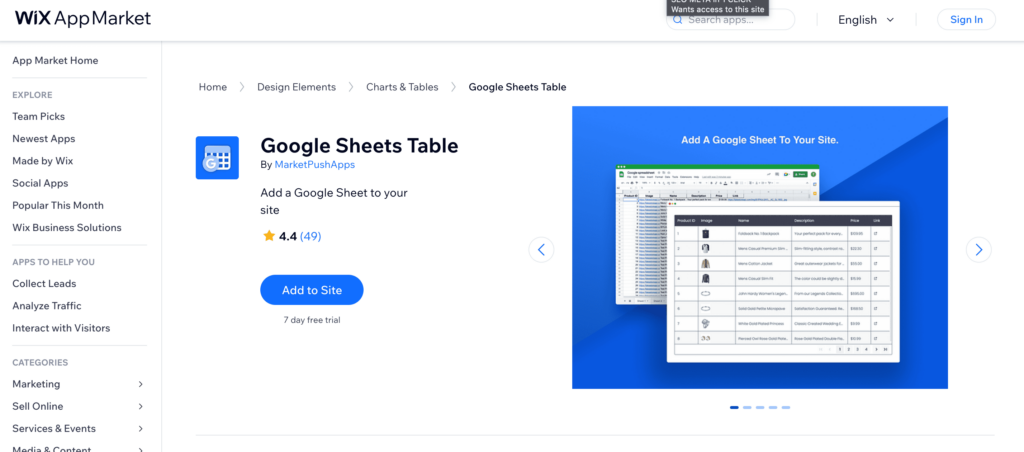
Google Sheets Table seamlessly integrates your Google Sheets data directly into your Wix website, making it an excellent tool for those who rely on real-time data updates and collaboration. This app allows you to display dynamic tables that automatically sync with, for example, your Google Sheets CRM template, ensuring your site always showcases the most current information. Perfect for businesses that require frequent data updates, such as sales reports, work schedules or inventories, Google Sheets Table simplifies the process of managing and presenting your data online. With easy setup and powerful synchronization features, this app enhances your ability to maintain accurate and up-to-date information on your site effortlessly.
Google Sheets Table Features
- Real-Time Sync: Automatically updates tables with the latest data from your Google Sheets.
- Easy Integration: Simple setup process to connect your Google Sheets to your Wix site.
- Customizable Tables: Adjust table design, including colors and fonts, to match your site’s style.
- Collaborative Updates: Reflects changes made by multiple users in real-time, perfect for team collaboration.
- Responsive Design: Ensures tables look great on all devices, including mobile and tablet.
Google Sheets Table Pricing
Free Plan
- Connect one Google Sheet
- Basic table customization options
- Real-time data synchronization
- Responsive tables
- Basic email support
Price: $0/month
Standard Plan
- Connect up to three Google Sheets
- Advanced table customization options
- Real-time data synchronization
- Responsive tables with interactive elements
- Priority email support
Price: $10/month
Premium Plan
- Connect unlimited Google Sheets
- Full table customization options, including advanced design settings
- Real-time data synchronization
- Fully responsive tables with interactive features
- Data import/export options
- Enhanced security features
- Priority support with live chat
Price: $20/month
Google Sheets Table Pros and Cons
Pros:
- Real-Time Sync: Automatically updates tables with the latest data from Google Sheets.
- Easy Integration: Simple and quick setup process to connect Google Sheets to your Wix site.
- Customizable Tables: Offers a range of customization options to match your site’s design.
- Collaborative Updates: Reflects changes made by multiple users in real-time, perfect for team collaboration.
Cons:
- Limited Free Plan: The Free Plan offers basic features and limited connections.
- Learning Curve: Advanced customization options may require some time to learn.
- Dependence on Google Sheets: Requires Google Sheets for data source, which may not suit all users.
- Cost: Higher pricing plans may be expensive for small businesses or personal sites.
3. Numbers: Show Animated Stats
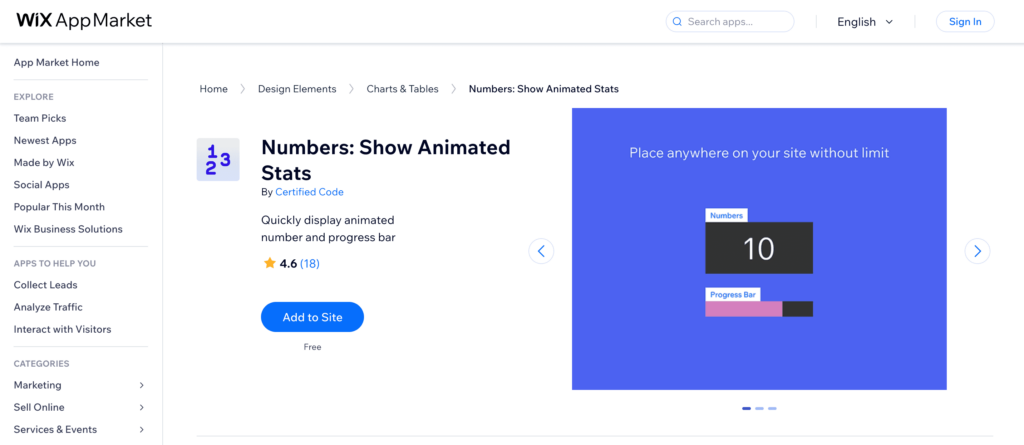
Show Animated Stats is an eye-catching app designed to bring your website’s data to life with stunning animated statistics. Whether you’re looking to highlight key performance metrics, display growth figures, or showcase any numerical data, this app provides a dynamic and visually appealing way to engage your visitors. With a variety of animation styles and customization options, you can tailor the appearance of your stats to perfectly match your site’s aesthetic. Ideal for business dashboards, portfolio sites, and more, Numbers: Show Animated Stats transforms static numbers into captivating visual elements that draw attention and communicate information effectively.
Numbers: Show Animated Stats Features
Here are five short bullet features of the Wix app Numbers: Show Animated Stats:
- Dynamic Animations: Bring your data to life with various animation styles.
- Customizable Designs: Adjust colors, fonts, and styles to match your site’s look.
- Real-Time Updates: Automatically update stats to reflect the latest data.
- Versatile Displays: Showcase any numerical data, from performance metrics to growth figures.
- User-Friendly Interface: Easy to set up and customize without needing coding skills.
Numbers: Show Animated Stats Pricing
Basic Plan
- Display up to 5 animated stats
- Access to basic animation styles
- Basic customization options
- Real-time updates
- Email support
Price: $4/month
Pro Plan
- Display up to 20 animated stats
- Advanced animation styles
- Full customization options
- Real-time updates with data import options
- Priority email support
Price: $12/month
Premium Plan
- Unlimited animated stats
- Premium animation styles
- Advanced customization and styling options
- Real-time updates with advanced data integration
- Enhanced security features
- Priority support with live chat
Price: $20/month
Numbers: Show Animated Stats Pros and Cons
Pros:
- Dynamic Visuals: Eye-catching animations make numerical data engaging.
- Customizable Designs: Extensive options to match your site’s aesthetic.
- Real-Time Updates: Automatically reflects the latest data.
- User-Friendly Interface: Easy to set up and customize without needing coding skills.
Cons:
- Limited Basic Plan: The Basic Plan offers limited stats and customization options.
- Learning Curve: Advanced features may take time to master.
- Data Integration Restrictions: More advanced data integration is available only in higher-priced plans.
- Cost: Higher pricing plans may be expensive for smaller websites or personal use.
4. Common Ninja Charts & Graphs
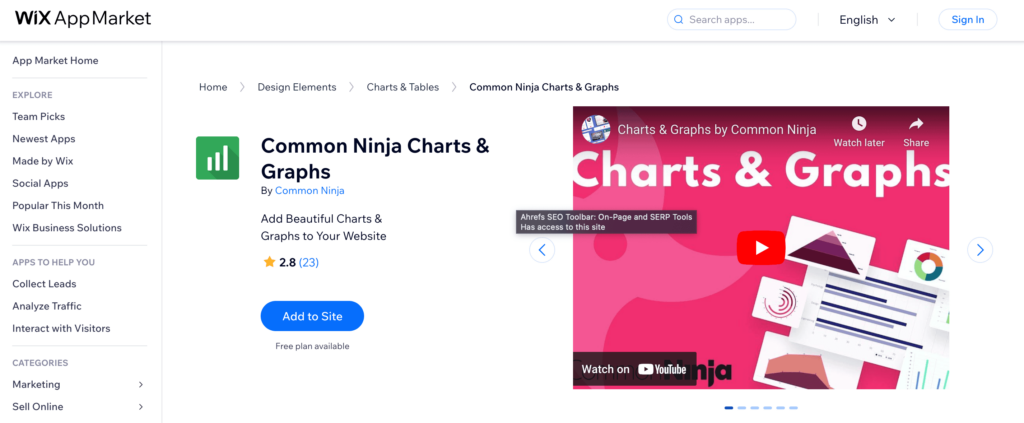
Common Ninja Charts & Graphs is a powerful app that allows you to create a wide variety of interactive and visually appealing charts and graphs for your Wix website. Whether you need to display sales data, track performance metrics, or present survey results, this app provides an extensive range of chart types and customization options to fit your needs. With its intuitive interface, you can easily design and embed charts that enhance the visual storytelling of your data. Perfect for businesses, bloggers, and educators, Common Ninja Charts & Graphs helps you transform complex information into engaging visuals that captivate your audience and convey your message effectively.
Common Ninja Charts & Graphs Features
- Variety of Chart Types: Create bar, line, pie, area, and more types of charts.
- Interactive Features: Add hover effects, tooltips, and clickable elements to enhance user engagement.
- Customizable Designs: Adjust colors, fonts, and styles to match your website’s theme.
- Easy Data Import: Import data from CSV files for quick chart creation.
- Responsive Charts: Ensure charts look great on all devices, including mobile and tablet.
Common Ninja Charts & Graphs Pricing
Here is a listing of the pricing plans for the Wix app Common Ninja Charts & Graphs:
Free Plan
- Access to basic chart types
- Basic customization options
- Limited interactive features
- Import data from CSV files
- Responsive charts
- Email support
Price: $0/month
Standard Plan
- Access to all chart types
- Advanced customization options
- Full interactive features
- Import data from CSV files
- Responsive charts with enhanced performance
- Priority email support
Price: $9/month
Premium Plan
- Unlimited access to all chart types
- Premium customization and styling options
- Advanced interactive features with real-time data updates
- Import and export data options
- Enhanced security features
- Priority support with live chat
Price: $19/month
Common Ninja Charts & Graphs Pros and Cons
Pros:
- Variety of Chart Types: Offers a wide range of chart types to suit different data presentation needs.
- Interactive Features: Enhances user engagement with hover effects, tooltips, and clickable elements.
- Customizable Designs: Provides extensive customization options to match your website’s look and feel.
- Responsive Charts: Ensures charts are optimized for all devices, including mobile and tablet.
Cons:
- Limited Free Plan: The Free Plan offers basic features and limited chart types.
- Learning Curve: Advanced customization and interactive features may require some learning time.
- Data Import Limitations: More advanced data import/export features are only available in higher-priced plans.
- Cost: Higher pricing plans may be costly for smaller websites or individual users.
5. Statify Pro
Statify Pro is an advanced app designed to elevate the way you present statistical data on your Wix website. Whether you’re showcasing business metrics, tracking user engagement, or presenting research findings, Statify Pro offers robust tools for creating detailed and visually appealing data visualizations. With a wide array of customizable options, you can tailor your charts and graphs to fit seamlessly with your site’s design. This app is perfect for businesses, bloggers, and analysts who need to display data in a clear and compelling manner, making it easier for visitors to understand and engage with complex information.
Statify Pro Features
- Advanced Data Visualization: Create detailed and visually appealing charts and graphs.
- Customizable Options: Tailor designs to match your site’s aesthetics with extensive customization settings.
- Real-Time Data Updates: Automatically sync and update data to ensure your stats are always current.
- Interactive Elements: Enhance user engagement with interactive features like hover effects and tooltips.
- Responsive Design: Ensure all visualizations look great on any device, including mobile and tablet.
Statify Pro Pricing
Basic Plan
- Create up to 5 visualizations
- Access to basic chart and graph types
- Basic customization options
- Real-time data updates
- Email support
Price: $6/month
Pro Plan
- Create up to 20 visualizations
- Advanced chart and graph types
- Full customization options
- Real-time data updates
- Interactive features (hover effects, tooltips)
- Priority email support
Price: $14/month
Premium Plan
- Unlimited visualizations
- All chart and graph types
- Premium customization and styling options
- Real-time data updates with advanced data integration
- Enhanced interactive features
- Enhanced security features
- Priority support with live chat
Price: $24/month
Statify Pro Pros and Cons
Pros:
- Advanced Data Visualization: Provides detailed and visually appealing charts and graphs.
- Customizable Options: Extensive customization settings to match your site’s aesthetics.
- Real-Time Data Updates: Ensures your stats are always current with automatic syncing.
- Interactive Elements: Engages users with interactive features like hover effects and tooltips.
Cons:
- Limited Basic Plan: The Basic Plan offers limited visualizations and features.
- Learning Curve: Advanced features and customization options may require some learning time.
- Data Integration Limitations: More advanced data integration options are only available in higher-priced plans.
- Cost: Higher pricing plans may be expensive for smaller websites or individual users.
6. Visual Stats Bar
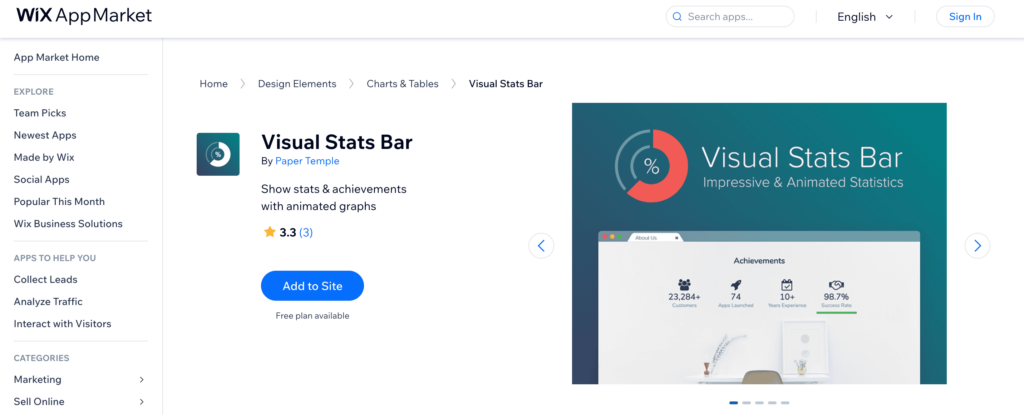
Visual Stats Bar is a sleek and user-friendly app designed to help you display data in a visually compelling bar format on your Wix website. Whether you’re highlighting key performance indicators, showcasing progress, or presenting comparative data, Visual Stats Bar makes it easy to create and customize bar graphs that enhance your site’s visual appeal. With its intuitive interface, you can quickly set up and modify bars to fit your specific needs, ensuring your data is both informative and attractive. Ideal for businesses, educators, and bloggers, this app transforms mundane statistics into engaging visual elements that captivate and inform your audience effectively.
Visual Stats Bar Features
- Customizable Bar Graphs: Easily adjust colors, sizes, and styles to match your site’s design.
- User-Friendly Interface: Intuitive setup and modification process, no coding required.
- Real-Time Data Updates: Automatically syncs to display the most current information.
- Responsive Design: Ensures bar graphs look great on all devices, including mobile and tablet.
- Interactive Elements: Add hover effects and tooltips to enhance user engagement and interaction.
Visual Stats Bar Pricing
Basic Plan
- Create up to 3 bar graphs
- Access to basic customization options
- Real-time data updates
- Responsive design
- Email support
Price: $3/month
Pro Plan
- Create up to 10 bar graphs
- Advanced customization options
- Real-time data updates with data import options
- Interactive elements (hover effects, tooltips)
- Priority email support
Price: $9/month
Premium Plan
- Unlimited bar graphs
- Premium customization and styling options
- Real-time data updates with advanced data integration
- Enhanced interactive elements
- Enhanced security features
- Priority support with live chat
Price: $18/month
Visual Stats Bar Pros and Cons
Pros:
- Customizable Bar Graphs: Offers extensive customization options to match your site’s design.
- User-Friendly Interface: Easy to set up and modify without requiring coding skills.
- Real-Time Data Updates: Ensures your bar graphs display the most current information.
- Responsive Design: Bar graphs are optimized for viewing on all devices, including mobile and tablet.
Cons:
- Limited Basic Plan: The Basic Plan offers limited bar graphs and customization options.
- Learning Curve: Advanced customization and interactive features may require some learning.
- Data Integration Limitations: More advanced data integration options are only available in higher-priced plans.
- Cost: Higher pricing plans may be expensive for smaller websites or individual users.
7. Numbers & Stats Counter
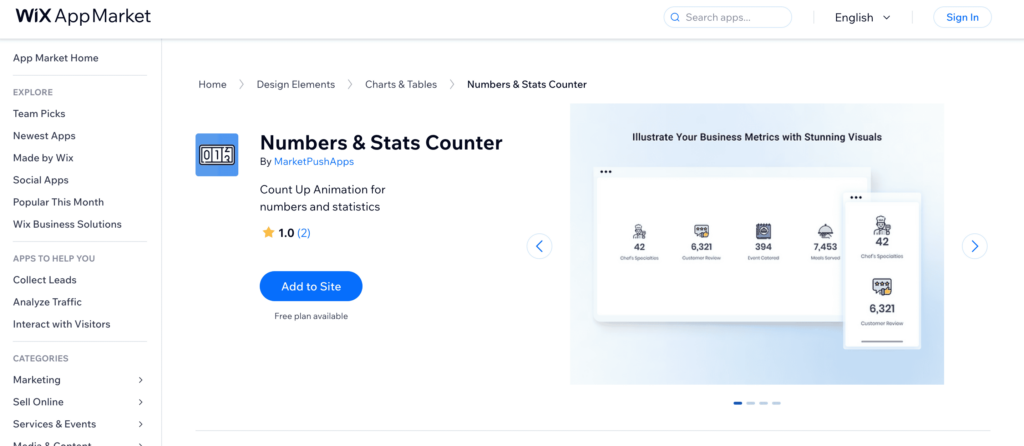
Numbers & Stats Counter is an excellent app for displaying real-time numerical data on your Wix website in a captivating way. Whether you need to show website visitor counts, sales figures, or any other important statistics, this app allows you to present numbers dynamically with customizable counters. Its user-friendly interface makes it easy to set up and integrate into your site, while a variety of styling options ensure it complements your design perfectly. Ideal for businesses, bloggers, and marketers, Numbers & Stats Counter provides an engaging way to highlight key metrics and keep your audience informed and impressed with real-time updates.
Numbers & Stats Counter Features
- Real-Time Counters: Display live updates of numerical data such as visitor counts and sales figures.
- Customizable Designs: Adjust colors, fonts, and styles to match your website’s aesthetic.
- User-Friendly Interface: Easy to set up and integrate without needing coding skills.
- Variety of Counter Styles: Choose from multiple counter styles to suit your data presentation needs.
- Responsive Design: Ensure counters look great on all devices, including mobile and tablet.
Numbers & Stats Counter Pricing
Free Plan
- Display up to 2 counters
- Access to basic counter styles
- Basic customization options
- Real-time updates
- Responsive design
- Email support
Price: $0/month
Standard Plan
- Display up to 10 counters
- Advanced counter styles
- Full customization options
- Real-time updates
- Priority email support
Price: $7/month
Premium Plan
- Unlimited counters
- Premium counter styles
- Advanced customization and styling options
- Real-time updates with advanced data integration
- Enhanced security features
- Priority support with live chat
Price: $15/month
Numbers & Stats Counter Pros and Cons
Pros:
- Real-Time Counters: Provides live updates for numerical data such as visitor counts and sales figures.
- Customizable Designs: Offers extensive options to adjust colors, fonts, and styles to match your site’s aesthetic.
- User-Friendly Interface: Easy setup and integration without requiring coding skills.
- Responsive Design: Ensures counters look great on all devices, including mobile and tablet.
Cons:
- Limited Free Plan: The Free Plan offers limited counters and basic styles.
- Learning Curve: Advanced customization and styling options may require some time to master.
- Data Integration Limitations: More advanced data integration options are only available in higher-priced plans.
- Cost: Higher pricing plans may be expensive for smaller websites or individual users.
Selection Methodology
To determine the best Wix Charts and Tables Apps, our team conducted a thorough evaluation of various apps available on the Wix platform. We compared multiple aspects such as user-friendliness, feature set, customization options, integration capabilities, pricing, customer support, and user reviews. Our methodology involved the following key criteria:
Ease of Use (25%): We assessed the intuitiveness of each app’s interface and the overall user experience. Apps that were easy to navigate, set up, and use without requiring extensive technical knowledge scored higher in this category.
Feature Set (30%): The breadth and depth of features offered by each app were evaluated. We looked at the variety of chart and table types available, customization options, data import/export functionalities, and any advanced features like interactivity and real-time updates.
Customization Options (20%): Customization is crucial for ensuring that charts and tables match the website’s aesthetic. We examined the flexibility in design options, including the ability to adjust colors, fonts, styles, and the ease of embedding these elements into a Wix site.
Integration Capabilities (10%): We considered how well each app integrates with other tools and platforms, such as Google Sheets, CSV file imports, and other data sources. Seamless integration is essential for maintaining up-to-date and accurate data visualizations.
Pricing and Value (10%): We reviewed the pricing plans of each app, considering the value offered at different price points. Apps that provided a good balance of features and affordability were rated higher.
Customer Support (5%): The quality and availability of customer support were evaluated. We looked for support options like live chat, email support, knowledge bases, and response times to ensure users can get help when needed.
User Reviews and Ratings (5%): Finally, we took into account user feedback and ratings from the Wix app market. Apps with consistently high ratings and positive user reviews were given extra points.
By applying this comprehensive evaluation framework, we identified the top Wix Charts and Tables Apps that offer the best combination of features, usability, customization, integration, pricing, and support, ensuring that users can choose the most suitable app for their website needs.
What to Look For in a Wix Charts and Tables App
When choosing a Wix Charts and Tables app, it’s important to consider a few key factors to ensure you select the best tool for your needs. First and foremost, ease of use is crucial. Look for an app with an intuitive interface that allows you to create and customize charts and tables quickly, even if you don’t have extensive technical skills. An app with a drag-and-drop builder or the best AI website builders can significantly simplify the process, enabling you to focus on designing your data presentations rather than struggling with complicated setup procedures.
Another important aspect to consider is the feature set. The best apps offer a wide variety of chart and table types, such as bar charts, line graphs, pie charts, and data tables. Additionally, customization options are essential for tailoring the visual elements to match your website’s design. This includes the ability to adjust colors, fonts, and styles. Integration capabilities are also important; an app that can seamlessly connect with tools like Google Sheets or allow for CSV file imports ensures your data stays up-to-date effortlessly.
Lastly, don’t overlook pricing and support. Evaluate the different pricing plans to find an option that offers good value for the features provided. It’s also beneficial to choose an app that offers reliable customer support, whether through live chat, email, or a comprehensive knowledge base, to assist you with any issues or questions that may arise. By considering these factors, you can find a Wix Charts and Tables app that enhances your website’s functionality and visual appeal.
Conclusion
In conclusion, selecting the right charts and tables app for your Wix website can significantly enhance your ability to present data in a clear, engaging, and visually appealing manner. Our curated list of the best Wix Charts and Tables Apps aims to help you make an informed decision by showcasing top options that excel in various aspects, including ease of use, feature set, customization, integration capabilities, pricing, and customer support.
We have chosen these apps based on their ability to transform complex data into digestible visual elements, making it easier for your audience to understand and engage with the information you present. Whether you need to display business metrics, track progress, or create interactive data visualizations, these apps offer robust tools and features to meet your needs. Each app has been evaluated for its unique strengths, ensuring that you can find the perfect fit for your specific requirements and website aesthetics.
By considering factors such as real-time data synchronization, extensive customization options, and seamless integration with other tools, these apps stand out as the best in their category. They provide a blend of functionality and user-friendliness, allowing you to create professional-looking charts and tables without needing extensive technical skills. With these top apps, you can enhance your site’s visual storytelling, engage your visitors, and present your data in a way that is both informative and captivating.
Ultimately, the right charts and tables app can make a significant difference in how effectively you communicate information on your website. We hope this article has provided valuable insights and helped you identify the best tools to elevate your data presentation and achieve your website goals.